Every developer knows the frustration: your application crashes, logs dump a wall of unformatted stack trace text, and you’re left squinting at method names and line numbers trying to piece together what went wrong. Stop wasting time on messy error logs.
TLDR - Why Use Debugly’s Stack Trace Formatter?
Problem: Raw stack traces are unreadable walls of text that hide the actual error.
Solution: Paste any Java or Python stack trace → Get instant analysis with:
- Root cause highlighting - See exactly what went wrong
- Clean formatting - Method calls clearly separated and highlighted
- Smart search links - Direct Google/Perplexity searches for solutions
- Exception chains - Navigate “Caused by” relationships easily
Try it now → No signup required, works instantly.
Debugly’s free stack trace formatter transforms chaotic Java and Python error output into clean, actionable debugging insights in seconds. No installation, no signup, no limits.
What Makes Stack Traces Hard to Read?
Raw stack traces are notoriously difficult to parse:
- Information overload: Dozens of method calls buried in a single block of text
- Hidden root causes: The actual problem is often buried under wrapper exceptions
- Poor formatting: No syntax highlighting or logical grouping
- Missing context: No quick way to search for solutions or documentation
Debugly’s Smart Stack Trace Parser
Our formatter doesn’t just pretty-print your errors—it intelligently analyzes them:
Automatic Language Detection
Paste any stack trace and Debugly automatically detects whether it’s Java, Python, or another supported language, applying the correct parsing rules.
Root Cause Analysis
Instead of hunting through nested exceptions, Debugly:
- Identifies the main exception and originating line
- Traces exception chains (“Caused by…” relationships)
- Highlights the deepest root cause that triggered the error cascade
- Provides context about where each exception occurred
Instant Search Integration
Every exception gets direct links to:
- Google searches with pre-formatted queries including class names and error messages
- Perplexity AI for context-aware solution suggestions
How to Use the Stack Trace Formatter
Step 1: Paste Your Error Log
Simply copy your entire stack trace from your IDE, logs, or terminal and paste it into the formatter. Here’s what happens when you paste a real Java exception:
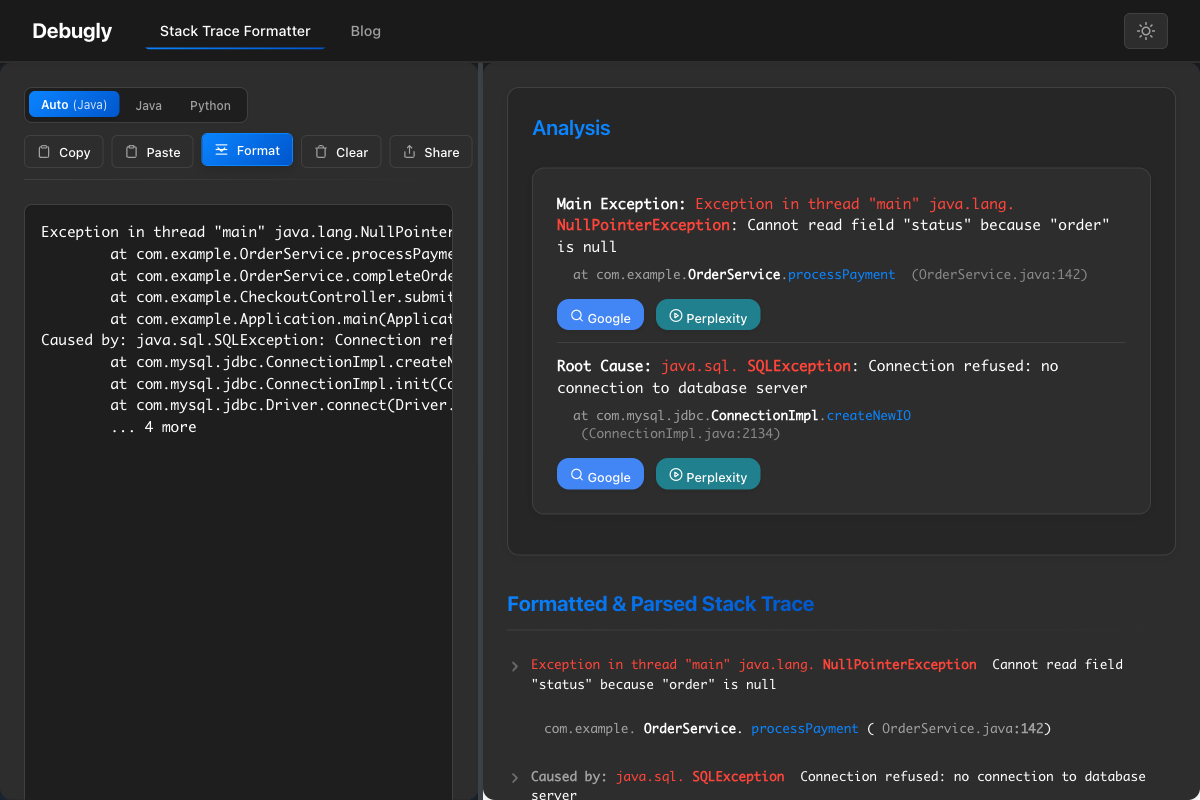
The formatter immediately:
- Detects this is a Java
NullPointerException - Identifies it’s chained with an underlying
SQLException - Highlights both the main exception and root cause
- Provides ready-to-click search links
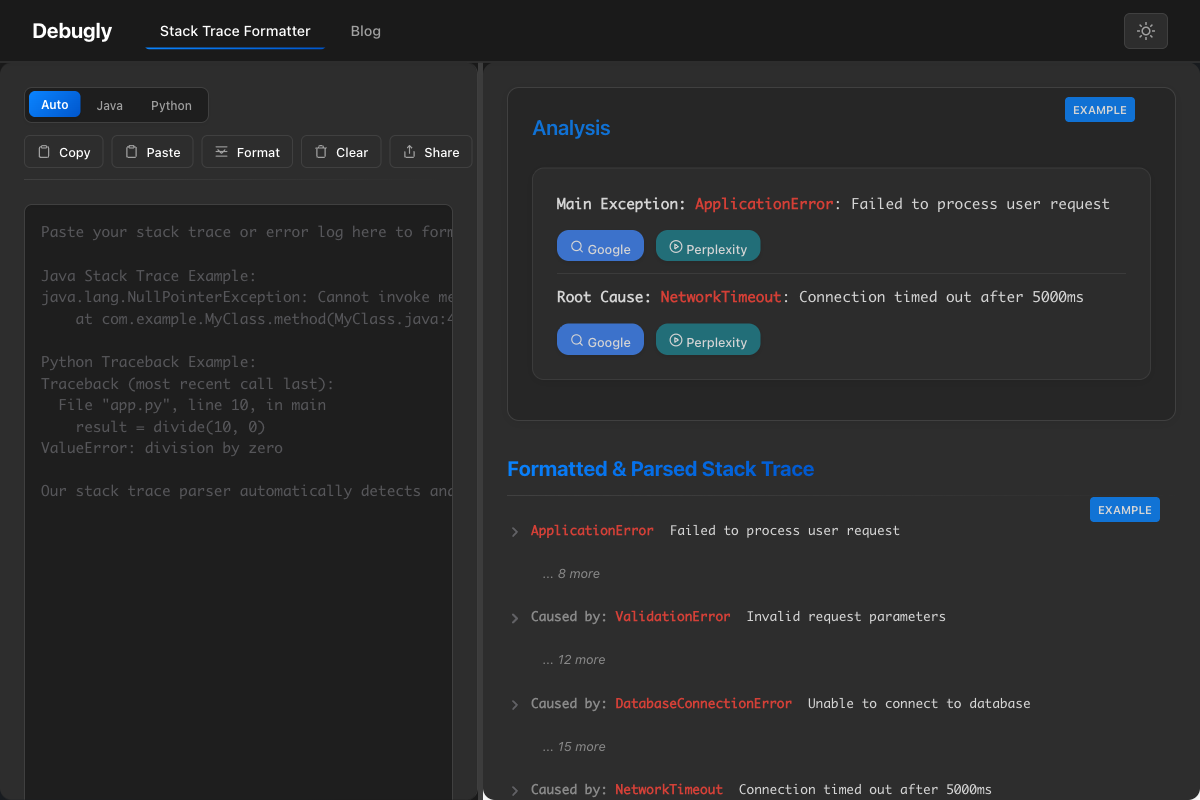
Step 2: Analyze the Results
The Analysis section breaks down complex error chains:
- Main Exception: Shows the top-level error that your application encountered
- Root Cause: Reveals the underlying issue that triggered the cascade
- Quick Actions: Search Google or Perplexity with pre-built queries
Step 3: Explore the Formatted Trace
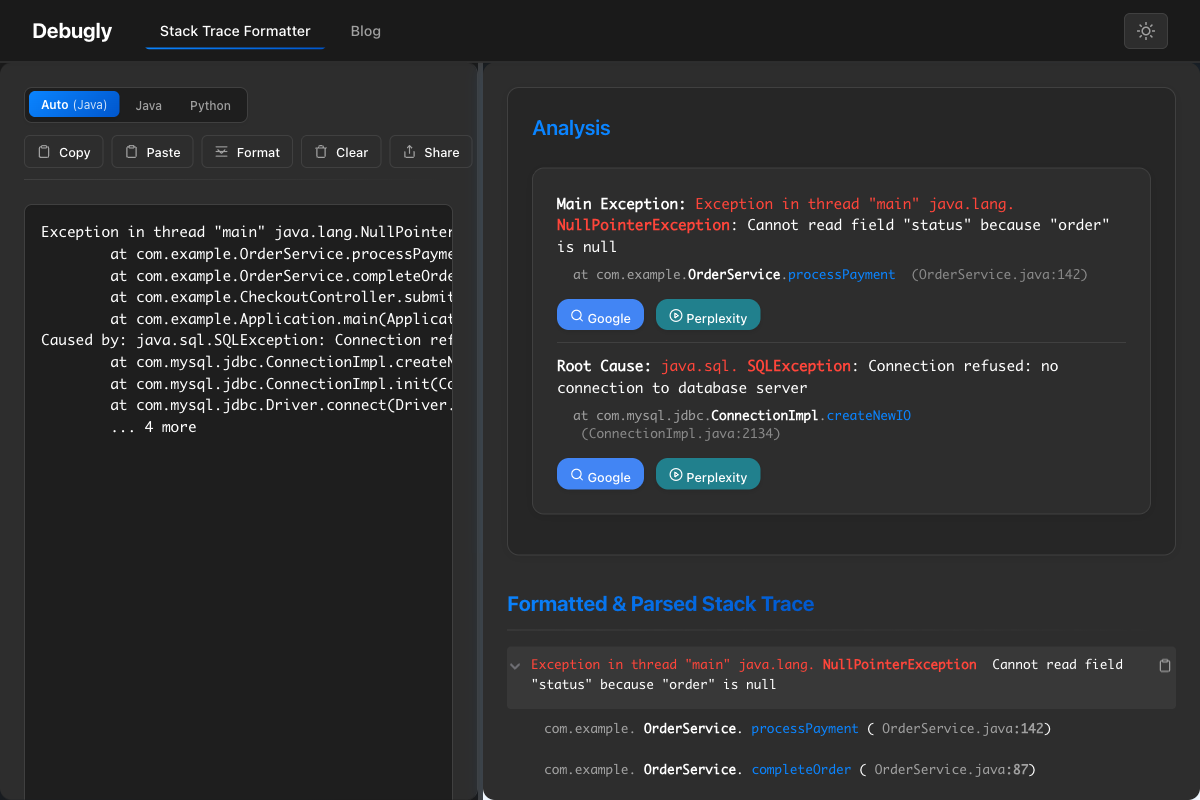
Click any exception to expand the full call stack:
- Method calls are clearly separated and highlighted
- File names and line numbers are clickable references
- Class hierarchies are visually organized
- Copy buttons let you extract specific exceptions
Supported Languages & Frameworks
Java Ecosystem
- Core Java: All standard exceptions (NullPointerException, IllegalArgumentException, etc.)
- Spring Framework: Spring Boot, Spring MVC, Spring Security errors
- JVM Languages: Kotlin, Scala, Groovy stack traces
- Enterprise: JPA, Hibernate, servlet container errors
Python Ecosystem
- Standard Library: All built-in exception types
- Web Frameworks: Django, Flask, FastAPI error traces
- Data Science: Pandas, NumPy, scikit-learn exceptions
- Async: asyncio and concurrent.futures errors
Real-World Debugging Scenarios
Production Database Connection Issues
java.lang.NullPointerException: Cannot read field "status" because "order" is null
    at com.example.OrderService.processPayment(OrderService.java:142)
    at com.example.OrderService.completeOrder(OrderService.java:87)
Caused by: java.sql.SQLException: Connection refused: no connection to database server
    at com.mysql.jdbc.ConnectionImpl.createNewIO(ConnectionImpl.java:2134)
Before Debugly: You’d spend time tracing through the call stack manually, possibly missing that the NullPointerException is actually caused by a database connection failure.
With Debugly: Instantly see that the root cause is SQLException: Connection refused, not a coding error. Get direct search links for MySQL connection troubleshooting.
Python API Integration Failures
Traceback (most recent call last):
  File "api_client.py", line 45, in fetch_user_data
    response = requests.get(url, timeout=5)
  File "requests/api.py", line 73, in get
    return request('get', url, params=params, **kwargs)
requests.exceptions.ConnectionError: HTTPSConnectionPool(host='api.example.com', port=443)
Result: Debugly highlights the ConnectionError as the root cause and provides search links specifically for requests.exceptions.ConnectionError solutions.
Advanced Features
Exception Chain Visualization
Complex applications often have multiple layers of exception wrapping. Debugly visualizes the entire chain, making it easy to understand how errors propagate through your application layers.
Shareable Links
Generate secure, shareable URLs for:
- Team collaboration: Send formatted traces to colleagues
- Bug reports: Include clean traces in issue tickets
- Code reviews: Reference specific errors in pull requests
Privacy-First Processing
- Client-side parsing: Your code never leaves your browser
- No data storage: Nothing is saved on our servers
- Secure sharing: Links encode data in the URL itself
Why Choose Debugly?
Completely Free
- No registration required
- No usage limits
- No hidden costs
- No advertisements
Developer-Focused
- Fast: Real-time parsing as you type
- Accurate: Handles edge cases and complex exceptions
- Comprehensive: Supports nested exceptions and custom error types
- Mobile-friendly: Works on any device
Time-Saving
- Instant analysis: No more manual trace reading
- Smart search: Pre-built queries save research time
- Root cause identification: Skip straight to the real problem
Best Practices for Stack Trace Analysis
Include Complete Traces
Always copy the full stack trace, including:
- The initial “Exception in thread” or “Traceback” line
- All “Caused by” or “During handling” sections
- The complete call stack (avoid truncated logs)
Understand Exception Propagation
In Java, read from bottom to top:
- Root cause (deepest “Caused by”)
- Propagation path (how the error bubbled up)
- Surface exception (what your application saw)
In Python, read from top to bottom:
- Initial call (where execution started)
- Call chain (method progression)
- Final exception (where execution failed)
Use Search Integration Effectively
- Google searches are best for common framework errors
- Perplexity searches provide more contextual, AI-powered explanations
- Include relevant class names and method signatures in manual searches
Get Started Now
Ready to transform your debugging workflow?
👉 Open Debugly Stack Trace Formatter
Paste your first stack trace and experience the difference. No signup required, completely free, and works instantly.
Frequently Asked Questions
Q: Is my code secure when using this tool? A: Absolutely. All processing happens in your browser. No stack traces are sent to or stored on any server.
Q: What languages are supported? A: Currently Java, Python, and other JVM languages (Kotlin, Scala). More languages are being added regularly.
Q: Can I use this for production errors? A: Yes! The formatter is designed for real-world debugging scenarios, including production stack traces.
Q: How do shareable links work? A: The formatted trace is encoded directly in the URL. No server-side storage means complete privacy.
Q: Does it work on mobile? A: Yes! The formatter is fully responsive and works on phones, tablets, and desktops.
Stop fighting unformatted stack traces. Visit debugly.pages.dev and start debugging faster today.